

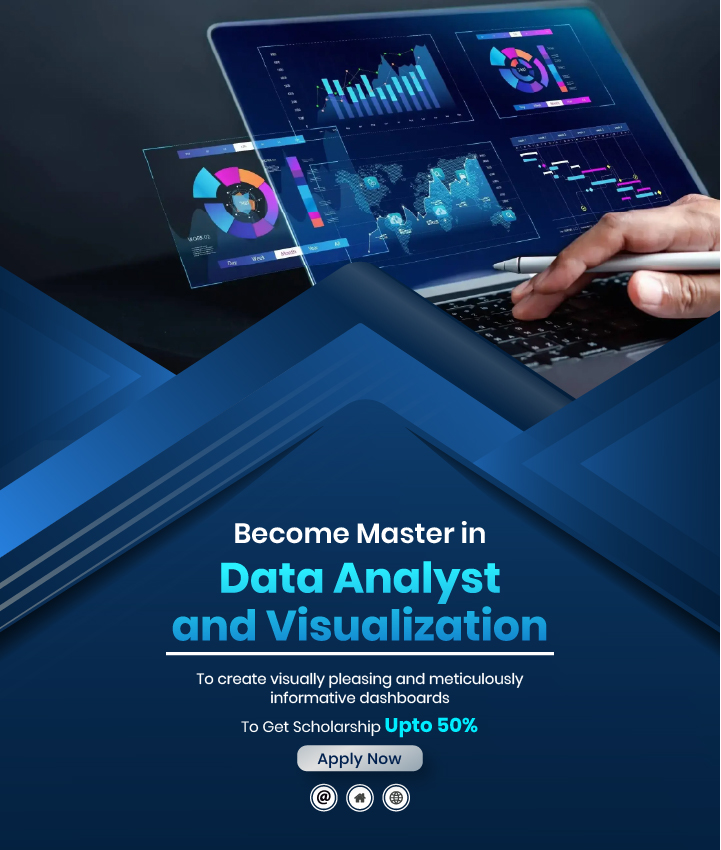
The Master’s in Data Analysis Course is a comprehensive program designed to equip learners with essential data analytics skills, including data visualization, business intelligence, programming, statistics, and advanced Excel techniques. The course provides hands-on training in tools such as Power BI, Tableau, SQL, Python, R, Google Sheets, and Excel VBA, along with AI-powered MS Office applications and Google Looker Studio for dashboard creation. With real-world capstone projects, learners will gain practical experience in analyzing data for decision-making in various domains like finance, sales, and inventory management.


Course Highlights
1. |
Advance Excel |
2. |
Power Query |
3. |
Excel VBA |
4. |
Google Sheets |
5. |
Office 365 |
6. |
MS Office with AI |
7. |
Google Looker Studio |
8. |
Power BI |
9. |
Tableau |
10. |
Python |
11. |
R Programming |
12. |
SQL |
13. |
Statistics & Probability |
14. |
Capstone Projects |
Learning Outcome
| • | Master Excel, Google Sheets, and Power Query for data manipulation and visualization. |
| • | Gain expertise in Power BI and Tableau for business intelligence and dashboard creation. |
| • | Develop programming skills in Python and R for data analysis and automation. |
| • | Learn SQL for data extraction, querying, and database management. | Read More |
| • | Understand statistics and probability to derive meaningful insights from data. |
| • | Build interactive dashboards and reports using Google Looker Studio. |
| • | Work on real-world projects to apply learned concepts in practical scenarios. | Read Less |
Tools that you will learn in this course


.png)
.png)


Course Content
| 1. | Excel Basics & Formatting |
| • | Introduction to MS Excel |
| • | Formatting Cell and Workbook |
| • | Page Setup |
| 2. | Data Handling & Manipulation |
| • | Sorting and Filtering data |
| • | Text to Column |
| • | Conditional formatting |
| • | Number formatting |
| 3. | Advanced Formulas & Functions |
| • | Mathematical Formulas |
| • | Date & Time Functions |
| • | Logical Functions |
| • | Text Functions |
| • | Lookup Functions |
| • | Introduction of Power Query in Excel |
| • | Installation of Power Query |
| • | Data connections |
| • | Data Cleaning |
| • | Data Transformation: - Append/Merge |
| • | Add Columns (Custom and conditional) |
| • | Loading data (load and load to) |
| • | Understanding of VBA and Macro |
| • | Variables & Data Types in VBA |
| • | Logical statements (if, else if, else, switch) |
| • | Operators |
| • | Loops in VBA |
| • | Error Handling |
| • | Message and Input Box in VBA |
| • | Working with worksheets in VBA |
| • | Introductions to Google Sheets |
| • | Import and export Data with Google sheet |
| • | Sorting and Filtering data |
| • | Create Filter views and clean data in Google Sheet |
| • | Lookup Functions Vlookup, Xlookup, Filter |
| • | Summarization Functions like SUM, COUNT, SUMIFS, COUNTIFS |
| • | IF and IFS functions |
| • | Advance Functions: - (Split, Import HTML, Import Range, Google Translate) |
| • | Spark Lines |
| • | Smart Chips |
| • | Improved Productivity |
| • | Improved Data Analysis |
| • | XLOOKUP in Office 365 |
| • | XMATCH in Office 365 |
| • | Making a Searchable Drop-Down List In Office 365 |
| • | Map Chart in Office 365 |
| • | Dynamic Conditional Formatting |
| • | Excel Sequence and Random Array Formula in Office 365 |
| • | Data Visualization |
| • | Intelligent Assistance |
| • | Time-saving Automation |
| • | Improved Communication |
| • | Intelligent Data Analysis |
| • | Customized Solutions |
| • | Improved Productivity |
| • | Improved Accuracy |
| • | Adaptive Learning |
| • | Empowered Creativity |
| • | Future-oriented Skills |
| • Introduction to Power BI |
| • Data Connectivity & Transformation |
| • Data Modeling & DAX (Data Analysis Expressions) |
| • Data Visualization & Interactive Reports |
| • Reports & Dashboards Development |
| • Business Intelligence & Data Analysis |
| • Sharing |
| • | Intro to Tableau Tool |
| • | Panes in Tableau |
| • | Shelves |
| • | Groups, Parameters |
| • | Filters in Tableau |
| • | Calculated Fields |
| • | Data Blending, Joins and Unions |
| • | Charts in Tableau |
| • | Map Chart in Tableau |
| • | Creating a Dashboard and Story |
| • | Tableau Public |
| • | Publish in Tableau Server |
| 1. | Introduction To Python |
| 2. | Python Language Fundamentals |
| 3. | Python Variables |
| 4. | Operators |
| 5. | Input & Output functions |
| 6. | Data Types And Structures In Python |
| 7. | String |
| 8. | List |
| 9. | Tuple |
| 10. | Set |
| 11. | Dictionary |
| 12. | Control statements |
| • | Logical control statement (if, elif, else) |
| • | Flow control statements (For, while) |
| 13 | Functional programming |
| • | User defined |
| • | Built-In |
| • | Introduction to R Programming |
| • | Variable and Operators |
| • | Conditional statements |
| • | Loops in R |
| • | Functions |
| • | Data Structures (Array, List, Matrix, Data Frame, Vector) |
| • | Plots |
| 1. | Introduction To SQL |
| 2. | Clauses in SQL |
| • | Select |
| • | From |
| • | Where |
| • | Distinct |
| • | Group by |
| • | Having |
| • | Order by |
| 3. | SQL Statements: |
| • | DDL (create, alter, drop, truncate) |
| • | DQL (select, clauses) |
| • | DML (Insert, update, delete) |
| • | DCL intro (grant, revoke) |
| • | TCL intro (Commit, Rollback) |
| 4. | SQL Advance: |
| • | SQL functions |
| • | Joins |
| • | Subqueries |
| • | Windows |
| • | Measures of Central Tendency (Mean, Median, Mode) |
| • | Measures of Dispersion (Range, Variance, Standard Deviation) |
| • | Skewness and Kurtosis |
| • | Percentiles and Quartiles |
| • | Boxplots and Outlier Detection |
| • | Basic Probability Concepts (Sample Space, Events, Conditional Probability) |
| • | Random Variables (Discrete & Continuous) |
| • | Probability Distributions (Normal, Binomial, Poisson, etc.) |
| • | Central limit theorem |
| • | Sampling Methods (Random, Stratified, Cluster, Systematic) |
| • | Confidence Intervals |
| • | Correlation Coefficient (Pearson, Spearman) |
Jobs and Career Opportunity After Completing Course
After completing this course you will get many job and career opportunities easily in the computer and IT field like e-commerce, government organizations, and security companies. You can start your early earnings with this course because there is no education criteria for this course and every business needs that kind of skilled employee. This course will also allow you to do work from home. After learning this course you can set up your own business.
Upon completing this course, you can pursue roles such as:
| Job profile After completing this course |
Average salary ( 1+ year experience) |
|---|---|
| Business Analyst | 3L-5L |
| Data Analyst | 1.5L- 4L |
| Data Engineer | 3L- 10L |
| Data Scientist | 4L- 15L |
| Data Architect | 14L- 25L |
| Database Administrator | 3L- 9L |

Backup Class

Flexible Timing

Fees Installment

Expert Trainer
100% job assistance
Free Library
.webp)
Live Project
.webp)
Practical learning

I'm currently enrolled in the Data Analyst course at IFDA Institute, and it's been an excellent experience. The curriculum is comprehensive and well-structured, covering essential topics like data visualization, statistical analysis, and SQL. The knowledgeable trainers provide real-world insights, making learning practical and engaging, and they offer valuable support for understanding complex concepts. The top-notch study materials, including video lectures, reading materials, and hands-on projects, have been particularly beneficial. Overall, I highly recommend IFDA Institute for its expert trainers, quality content, and supportive environment.

Hi, I am Rohit Vats I recently completed the Business Analyst course, and it’s been an eye-opener! As a student aiming to enter the data and business strategy field, this course gave me a solid foundation in both technical and analytical skills.

It is great opportunity for me that I'm enrolled in ifda institute as a data analyst learner as this institute has alot of good experience and valuable experienced faculty and they provide a valuable skills and great knowledge to learner.
0K +
0K +
0+
.webp)
0+
Frequently Asked Questions
Students who have completed their 12th standard can easily enroll in this course. Students with a base in science and programming could leverage better advantage of the course.
The course will be 6 months long, with each class being one hour every day.


Get free counselling by our experience counsellors. We offer you free demo & trial classes to evaluate your eligibilty for the course.
Have you
Any question
Or need some help?
Please fill out the form below with your enquiry, and we will respond you as soon as possible.