
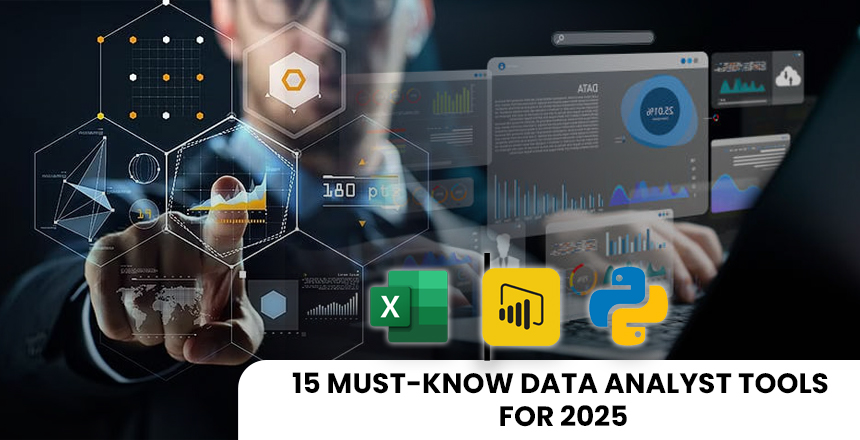
Everyone knows that in the modern world, where information is the key asset, data analysts are
more in demand than ever. Over the years, companies have produced more data than ever
before; people who can analyze it and make strategic decisions have become scarce
commodities. There is no doubt that data analysis is an essential skill to stay updated for the
business and to excel in your career; here is the list of 15 data analyst tools for 2024. Most of
the tools suggested below are aimed at making your job easier by helping you manage data,
analyze it, and even visualize it.
- Tableau: SAP Business Objects is an expensive tool of data analysis and business
intelligence, through which data analysts can generate dashboards, charts, and graphs. This
tool is very simple to use and efficient with different types of data, always a handy tool for any
analyst. - Python: Python is the language of choice for data analysts because of its convenience and
flexibility. Python is used for advanced data manipulation and data analysis and for the creation
of new tools and scripts for repetitive operations. - R: R is another robust programming language which is popularly used by data analyst for
statistical computing, analysis etc. It has a rich collection of the packages that addresses the
needs for tuning sophisticated statistical and graphical analyses. - Microsoft Power BI: Power BI is a business analytics tool create by Microsoft that enables the
visualization and analysis of data in an understandable format. While it effectively links to other
programs, which are produced by Microsoft for example Excel, it can also be used by small and
extended research. - Google Data Studio: Data Studio is a free tool for creating business analytics dashboards and
reports, which allow data analysts to use data from different sources including Google Analytics
or Google Ads. - SQL: Fundamentally, SQL, or Structured Query Language, is the standard language used for
managing and manipulating data in relation to databases. It goes without saying that every data
analyst gives one or another look at SQL query language and (or) uses it for data retrieval. - Looker: Looker is an integrated business intelligence tool that allows the consumer to analyze
data from different applications. It comes with convenient data modeling to help the user gain a
better understanding of the data structure and find interesting patterns. - Qlik: Qlik is an advanced data discovery tool through which users can attend compelling
visualizations and dashboards. It is best recognized for its in-memory technology that enables
the immediate processing of the heavy information sets. - Alteryx: Alteryx is the tool that allows blending, preparation, and analyzing data originating
from different sources. Its user-friendly interface also makes it appropriate for users who are just
beginning their careers as well as experienced data analysts. - Databricks: Databricks is a cloud-solving tool for data engineering and data science that
combines data analysts working on data pipelines, machine learning algorithms, and live
dashboards. It is a choice data analysis toolkit in which the tool can be integrated with many
languages like Python, R, and SQL. - Apache Spark: Apache Spark is actually a big data computation framework for large-scale
data engineering and processing in real time. It sits well with data scientists and data engineers
who deal with big data projects. - Snowflake: Thus, Snowflake is a company that provides data warehousing services through
cloud computing solutions that allow analysts to keep data and analyze it with low cost and high
performance. That can be done easily since it has been designed for small, medium, and even
large businesses. - Matplotlib: Matplotlib is a plotting library in Python that is used to create popular forms of
static and animated graphics, as well as the newly introduced interactive mode. Matplotlib is
quite popular among data analysts to generate clear and professional publication figures. - Seaborn: Seaborn is another visualization of statistical data and information in the Python
library. This is based on Matplotlib and supports various in-built themes and color palettes to
help one develop high-quality graphics figures. - Power Pivot: Power Pivot is a tool that is an integrated part of Excel, and it helps data
analyst with high-level analysis and data modeling. Besides, it enables users to develop
detailed models and simple mathematical operations as well as generate user-friendly
dashboards.
Finally, the tools mentioned in this paper are critical for anyone who wants to be a master data
analyst in the year 2024. By learning about the tools mentioned above and their utility, you will
become capable of handling data-oriented tasks in a company and making a correct decision,
which will eventually lead to successful business outcomes.

Take a look at how IFDA helps you to have a great career by delivering the best content and practice.